Xiao-Zhuo Qi(祁晓卓) and Xi-Feng Ren(任希锋)
1CAS Key Laboratory of Quantum Information,University of Science and Technology of China,Hefei 230026,China
2CAS Synergetic Innovation Center of Quantum Information and Quantum Physics,University of Science and Technology of China,Hefei 230026,China
Keywords: integrated optics,frequency conversion
Transition metal dichalcogenides (TMDs) are widely used as building blocks for various optical systems due to their significant optical properties.[1]Some kinds of TMDs, such as tungsten sulfide(WS2),[2]molybdenum sulfide(MoS2),[3,4]and tungsten selenide(WSe2),[5]have a large second harmonic generation (SHG) response due to the symmetry breaking of the crystal structure.[6,7]An odd-layer 2H phase TMD can generate a strong second harmonic,[8–10]and the intensity of the SHG signal decreases as the number of layers increases.[6]The SHG from monolayer TMD is not limited by momentum matching because of the much smaller thickness of the monolayer TMD than the pump and harmonic wavelengths.[6,11]However, the thickness becomes a constraint for nonlinear conversion efficiency because of limited interaction length.[11]
Furthermore, coupling TMDs with micro/nanostructures can enhance SHG conversion efficiency. In this way, the evanescent field confined by the micro/nanostructure can directly interact with the material. As an effective method,twodimensional materials are reported to be coupled with various micro/nanostructures, such as waveguides,[12,13]fibers,[14–16]and microcavities.[1,17,18]In addition, monolayer TMDs can also be fabricated as microscale heterojunctions.[19]In particular, two-dimensional materials coupled with cavity structures can increase the interaction with the electromagnetic field,which can greatly enhance the photoluminescence,[20,21]Raman signal,[22]and SHG.[18]There are a variety of cavity structures that have been used to enhance the coupling strength between the two-dimensional material and the light field, including surface plasmon structures,[21–26]microdisks,[20]microspheres,[17,18,27]photonic crystals,[28,29]metasurfaces,[30,31]and photonic bound states in the continuum.[32]Within these structures, the microsphere cavity has the advantages of a high quality factor and easy fabrication.[17]A research group reported the enhancement of SHG from WS2by placing microspheres on monolayer WS2.[18]However,the SHG conversion efficiency is still low,and particularly the SHG conversion efficiency simultaneously enhanced by microsphere cavity has not been studied in theory.
In this work, we theoretically calculate the SHG conversion efficiency of monolayer WS2deposited on the surface of a silica microsphere. We study the cases in which the pump and SHG signals both resonate with the cavity modes in the SHG process. The wavelengths of the pump mode are around 1550 nm and the wavelengths of the SH mode are around 775 nm. Considering the cavity mode symmetry,we study the second-order nonlinear coupling between the fundamental pump mode and the different second harmonic(SH)modes. Monolayer WS2can be deposited with different positions, sizes, and crystal orientations on the microsphere,which enables flexible mode to match with odd/even order or different polarization directions. In our simulation, we theoretically obtain an optimized SHG conversion efficiency of 3.35%with 1 mW pump power under a typical quality factor(1×10⁶). This result is three orders of magnitude higher than the SHG conversion efficiency of monolayer WS2currently reported.[33]
In our work,monolayer WS2is deposited on the surface of a silica microsphere,as shown in Fig.1(a). The plane of the blue dashed circle is the equatorial plane of the microsphere cavity. The angleθrepresents the position of WS2relative to the equatorial plane. A coordinate system is established on the surface of the microsphere, where thexaxis is in the latitude direction, theyaxis is in the longitude direction and thezaxis is in the normal direction of the microsphere surface. The length of the material in thexdirection isl, and the length in theydirection isw. The monolayer WS2studied in this work belongs to the point group ofD3h, and the schematic is shown in Fig.1(b). We set the angle between thebaxis of the crystal orientations and theyaxis of the surface coordinates asΩ. The thickness of the material is approximately 0.65 nm.[11]The finite element analysis is performed to analyze the coupling strength between the material and the microsphere. Because of the rotational symmetry of the microsphere cavity mode,[34]we use a 2D rotational symmetry model to simplify the simulation model. In the simulation, it is assumed that the material position does not affect the cavity mode because the thickness of the material is three orders of magnitude smaller than the wavelength.
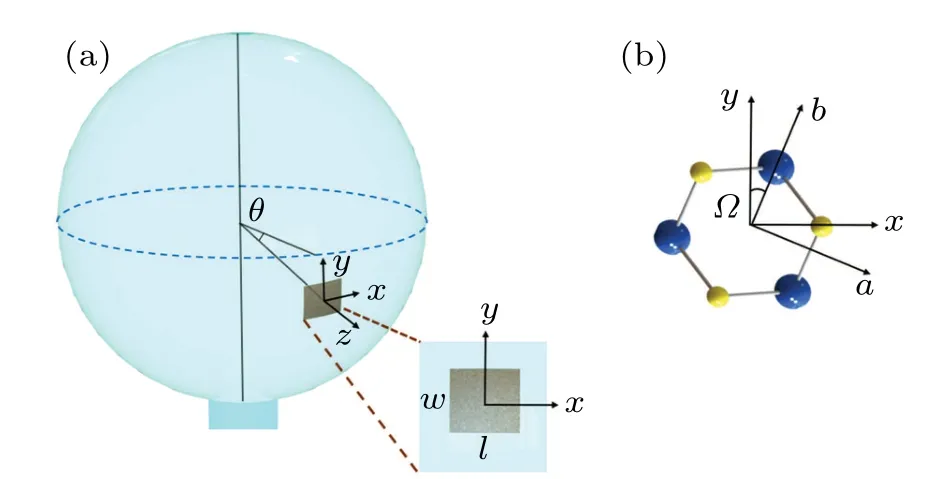
Fig.1. (a)Schematic of the system. The plane of the blue dashed circle is the equatorial plane. The inset is a schematic of the material with the in-plane coordinates. (b)Demonstration of the angle(Ω)between the crystal orientations(a,b)and the coordinates(x,y).
Here,ε0is the vacuum permittivity,andεjis the relative permittivity of the medium. SubstitutingEj(r,t) into Eq. (1)yields
For the integral overφ,gis nonzero only whenm2-2m1=0, which corresponds to the momentum-conservation condition.[35]We substitute the energy normalization condition and introduce the effective mode overlap factor as
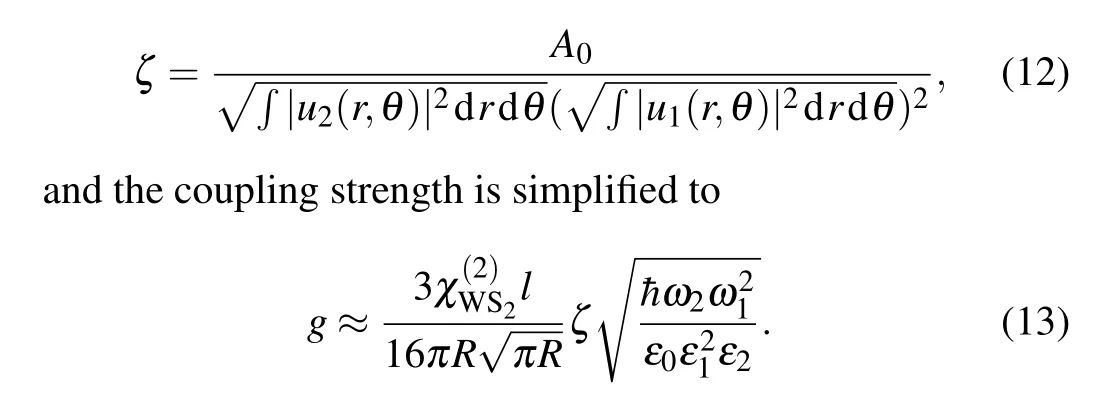
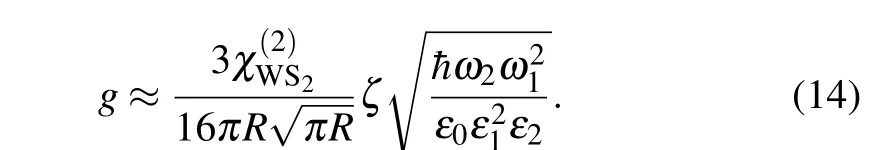
Here, we approximate that the radius (R) of the microsphere is much larger than the width of the cavity mode in the radius direction.[35]The coupling strength is proportional tol,which is the size of the material. By normalizing the coupling strength withl,we obtain the coupling strength
We choose wavelengths of 1550 nm for the pump mode and 775 nm for the SH mode. For monolayer WS2, only the electric field in the material plane contributes to the SHG process. Compared with the transverse magnetic(TM)mode,the electric field component of the transverse electric (TE) mode is stronger in the material plane.[36]Therefore,we choose the fundamental TE(TE0)mode as the pump mode.The SH mode should satisfy both energy conservation (2ω1=ω2) and momentum conservation (2m1=m2) to obtain a large SH signal. Since the mode dispersion is used to compensate for the material dispersion,[35]we need a different mode from the TE0mode for the second harmonic. The symmetry of the odd-or even-order SH mode will affect the nonlinear coupling strength with the pump mode, and we discuss these different cases.
For the even-order TE SH mode, the profile of the cavity mode is symmetrical. In this situation,we choose the TE2mode as a typical sample. The resonance frequency detuning of the pump mode and SH mode is zero when the condition of momentum is fulfilled(2m1=m2)to satisfy the conservation of energy. The detuning of the resonant frequency is denoted asδ=(ω1-ω2/2). We show the relationship between the resonance frequency detuning and the microsphere radius in Fig.2(a). The blue points in this figure are the simulated frequency detuning, and the red curve is the fitting curve with polynomial fitting. The frequency detuning is zero when the radius is about 112 μm. Although it is difficult to precisely control the radius of the microsphere cavity,the frequency detuning can be tuned to zero by thermal and Kerr effects[36]to achieve ideal conditions in the experiment. To show the symmetry of the electric field,theycomponent of the electric field(Ey)profiles of the pump mode and the SH mode are shown in Figs.2(b)and 2(c),respectively.TheEyof the pump mode has the same sign.Different from the pump mode,theEyof the SH mode can be positive or negative in different positions,which may lead to the cancelation of the coupling strength. Therefore,we investigate the effect of material position on the coupling strength. The dependence of the coupling strengthgon the material positionθis shown in Fig.2(d),wherewis 5 μm andΩis 0°. Three peaks of coupling strength can be found,and the strongest coupling strength occurs atθ=0°due to the symmetry of the SH (TE2) mode. We further scanwof the material to find the dependence of the coupling strength on the range of the interaction area atθ=0°,as shown in Fig.2(e).We obtain a maximum coupling strength of 1556 Hz/μm whenwis 4.2 μm. As the material coverage continuously increases,the coupling strength decreases because of the cancelation.
For the odd-order TE SH mode, the profile of the cavity mode is anti-symmetry. In general, SHG conversion will be canceled by the anti-symmetric mode profile.[35]However,the flexible choice of position and size of monolayer WS2can avoid cancelation caused by the anti-symmetric mode profile.To study this case,we choose the TE3mode as a typical sample. The frequency detuning dependence on the microsphere radius is illustrated in Fig. 3(a). The frequency detuning is zero when the radius is around 88 μm. TheEyprofile of the SH mode is shown in Fig.3(c),which exhibits anti-symmetry different from the TE2mode. The dependence of the coupling strength on the position (θ) of the material is shown in Fig. 3(d), wherewis 5 μm andΩis 0°. Due to the antisymmetry of the TE3mode, the coupling strength is minimal whenθis 0°. We find that the coupling strength reaches a maximum whenθis 1.2°. In this position,the dependence of the coupling strength onwof the material is shown in Fig.3(e).We obtain the maximum coupling strength of 2225 Hz/μm whenwis 3.9 μm.
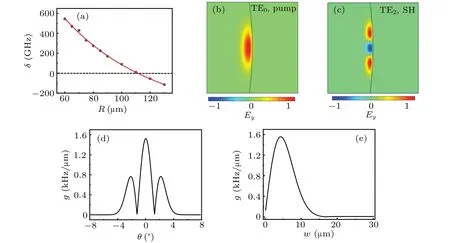
Fig.2.(a)The resonance frequency detuning[δ=(ω1-ω2/2)]of pump mode(TE0,ω1)and SH mode(TE2,ω2)depending on the microsphere radius. Here,the black dashed line is δ =0. (b)Normalized y component of the electric field(Ey)profile of pump mode(TE0). (c)Normalized Ey profile of the SH mode(TE2).(d)Dependence of the coupling strength between the TE0 mode and TE2 mode on the position of the material.(e)Dependence of the coupling strength between the TE0 mode and TE2 mode on w of the material.
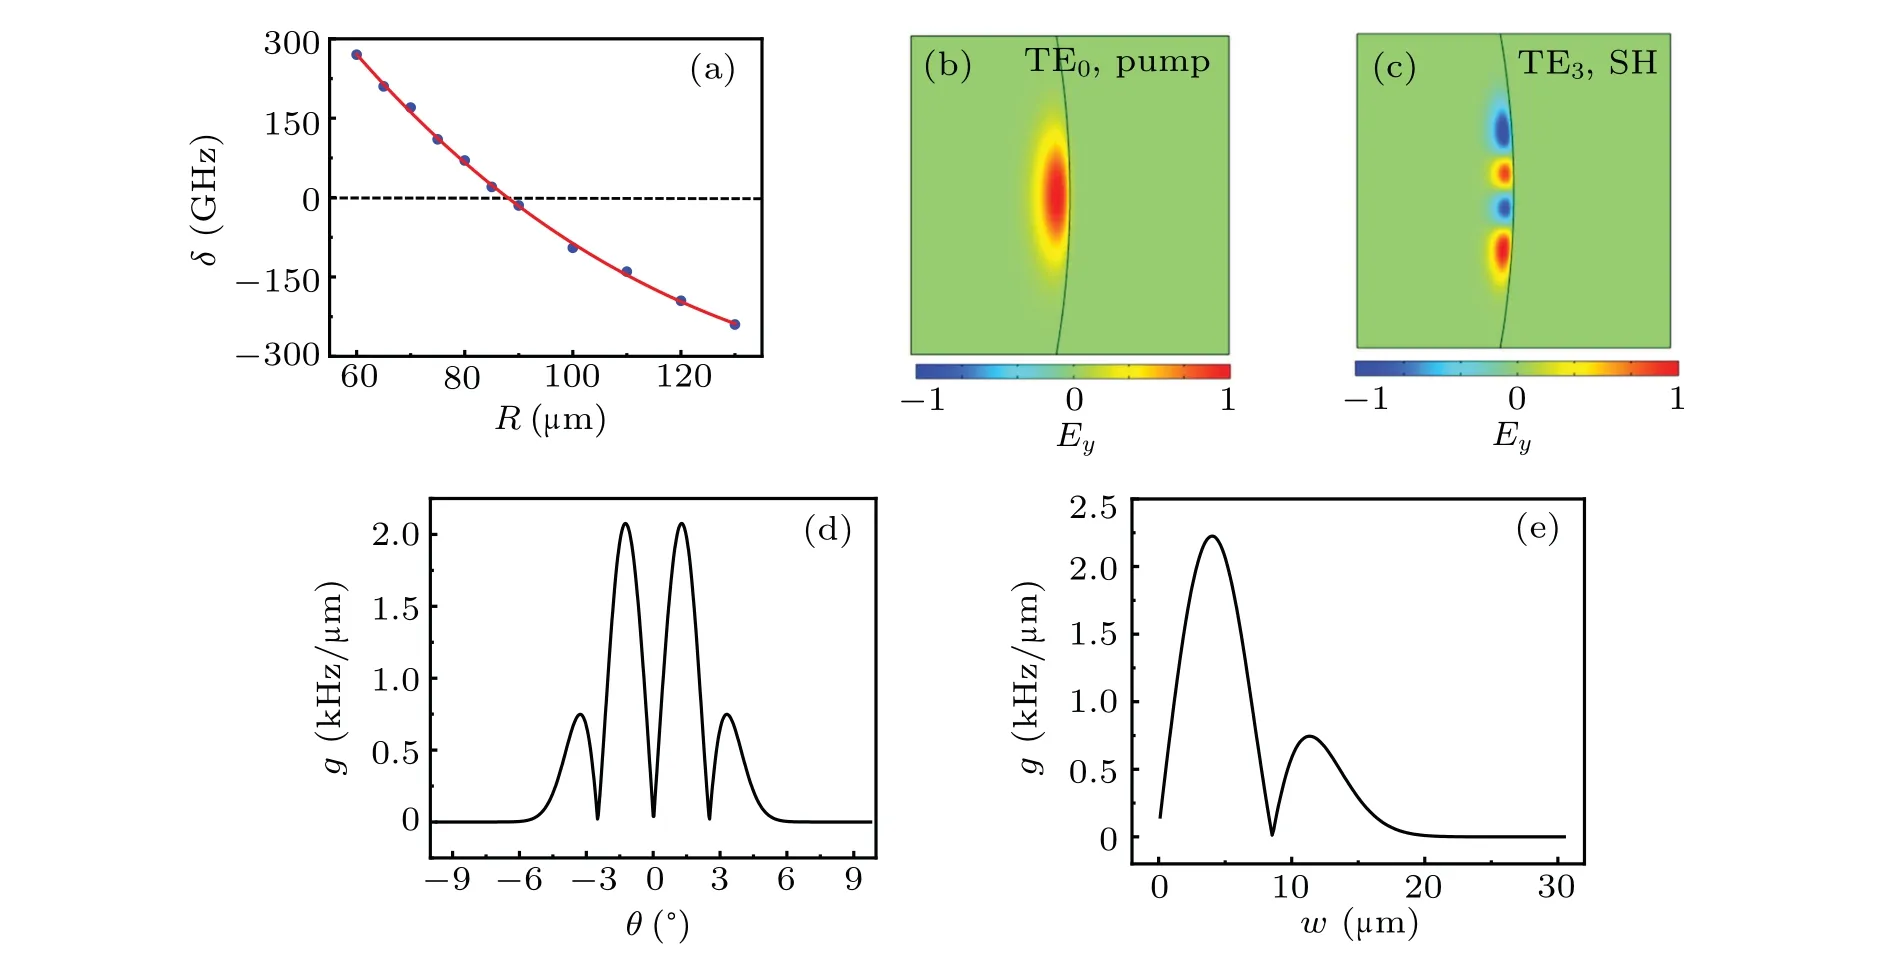
Fig.3.(a)The resonance frequency detuning[δ=(ω1-ω2/2)]of pump mode(TE0,ω1)and SH mode(TE3,ω2)depending on the microsphere radius. Here,the black dashed line is δ =0. (b)Normalized Ey profile of pump mode(TE0). (c)Normalized Ey profile of the SH mode(TE3).(d)Dependence of the coupling strength between the TE0 mode and TE3 mode on the position of the material. (e)Dependence of the coupling strength between the TE0 mode and TE3 mode on w of the material.
Furthermore, we analyze the coupling strength when the SH mode is the fundamental TM(TM0)mode. The frequency detuning dependence on the microsphere radius is illustrated in Fig. 4(a). The frequency detuning is zero when the radius is around 140 μm. The pump mode and the SH mode have different electric field polarizations on the surface of the microsphere, as shown in Figs. 4(b) and 4(c), respectively.Exis much stronger thanEyof the TM0mode(SH)in the plane of the material.[36]We can generate SHG withExby rotating the crystal orientation of the material. TheExprofiles of the pump mode and the SH mode are shown in Fig. 4(d). The dependence of the coupling strength on the position (θ) of the material is shown in Fig. 4(d), wherewis 5 μm.Ωis 90°to ensure that the coupling strength is affected byExwith Eq.(9). The coupling strength reaches a maximum whenθis 0°because of mode symmetry. We further find that the coupling strength increases with the range of the interaction area as shown in Fig.3(e),because theExof the TM0mode has the same sign on the microsphere surface. The coupling strength is 1250 Hz/μm when the material completely covers the range of the cavity mode on the microsphere surface.
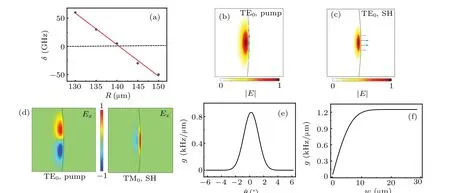
Fig. 4. (a) The resonance frequency detuning [δ = (ω1-ω2/2)] of pump mode (TE0, ω1) and SH mode (TM0, ω2) depending on the microsphere radius. Here,the black dashed line is δ =0. (b)Normalized electric field intensity(|E|)profile of pump mode(TE0). The blue arrows represent the direction of electric field polarization. (c)Normalized|E|profile of the SH mode(TM0). The blue arrows represent the direction of electric field polarization. (d) Normalized electric field component in x-direction (Ex) profiles of the pump and SH modes. (e)Dependence of the coupling strength between the TE0 mode and TM0 mode on the position of the material. (f)Dependence of the coupling strength between the TE0 mode and TM0 mode on w of the material.
According to the results,we obtain the strongest coupling strength,which isg=2225 Hz/μm. Here,the pump mode is the TE0mode,the SH mode is the TE3mode,θis 1.2°,andwis 3.9 μm.We further study the influence of crystal orientation on the coupling strength with these parameters. The dependence of the coupling strength onΩis shown in Fig.5(a).This dependence is similar to the polarization dependence of the SHG generated by the free-space linearly polarized pump laser because of the structural symmetry of monolayer WS2.[11]The total Hamiltonian of the SHG process can be expressed as[35]
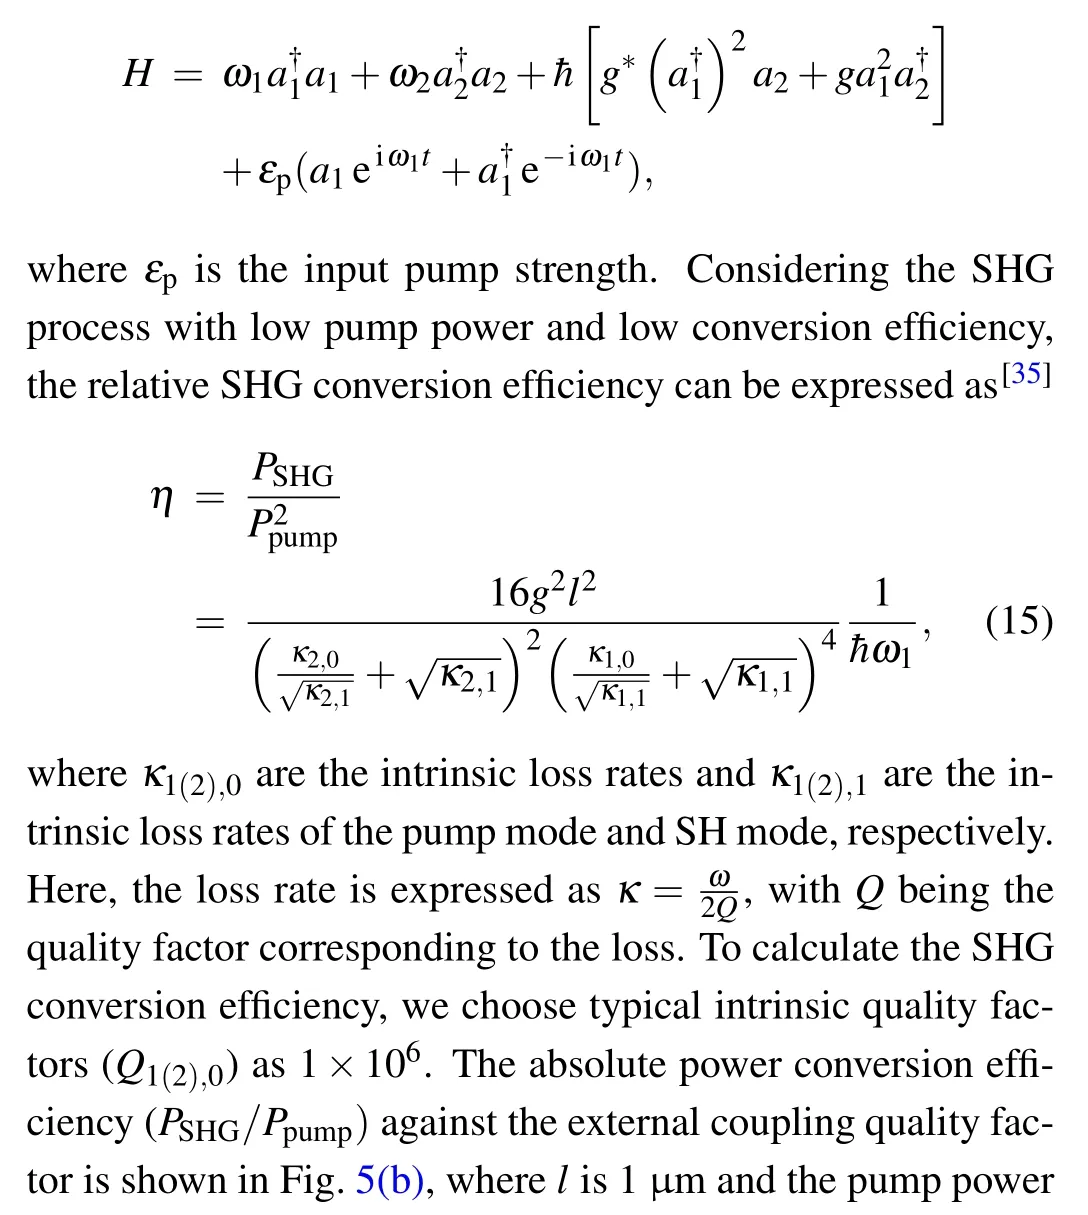
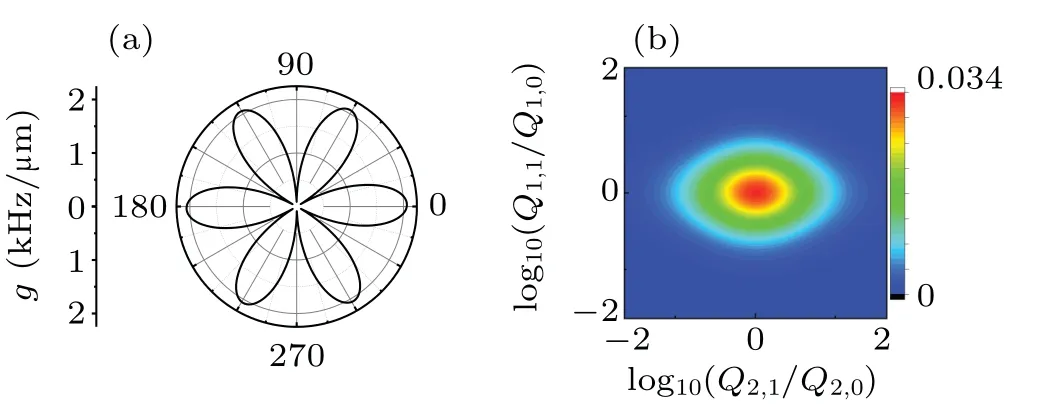
Fig.5. (a)Dependence of the coupling strength on Ω. Here the pump mode is the TE0 mode, the SH mode is the TE3 mode, θ is 1.2°, and w is 3.9 μm. (b) Absolute power conversion efficiency (PSHG/Ppump)against the external coupling quality factor(Q1(2),1). In the calculation,the intrinsic quality factors(Q1(2),0)are 1×10⁶,and the pump power is 1 mW.
In summary, we have theoretically studied the SHG of monolayer WS2coupled with a silica microsphere cavity. We consider that monolayer WS2is deposited on a microsphere with different positions, sizes, and crystal orientations and flexibly matches different modes with odd/even order or different polarization directions. We calculate the dependence of the coupling strength in these cases. The theoretical calculation of the optimal SHG conversion efficiency is 3.35%under the typical quality factor(1×10⁶)and pump power (1 mW).Increasing the length of the material in thex-direction, improving the quality factor of the cavity, and increasing the pump power can further increase the SHG conversion efficiency. These results provide guidance to achieve optimal second-order nonlinear response with the microsphere cavitycoupled two-dimensional material,which will be further used in more applications for integrated optical systems.
Acknowledgements
Project supported by the National Natural Science Foundation of China(Grant Nos.11774333 and 62061160487)and the Fundamental Research Funds for the Central Universities.